Plot the fitted or residual curves of a FARFIMA fit
plot.farfima.RdRainbow plots of the in-sample fit of a model from farfima(), coloured by
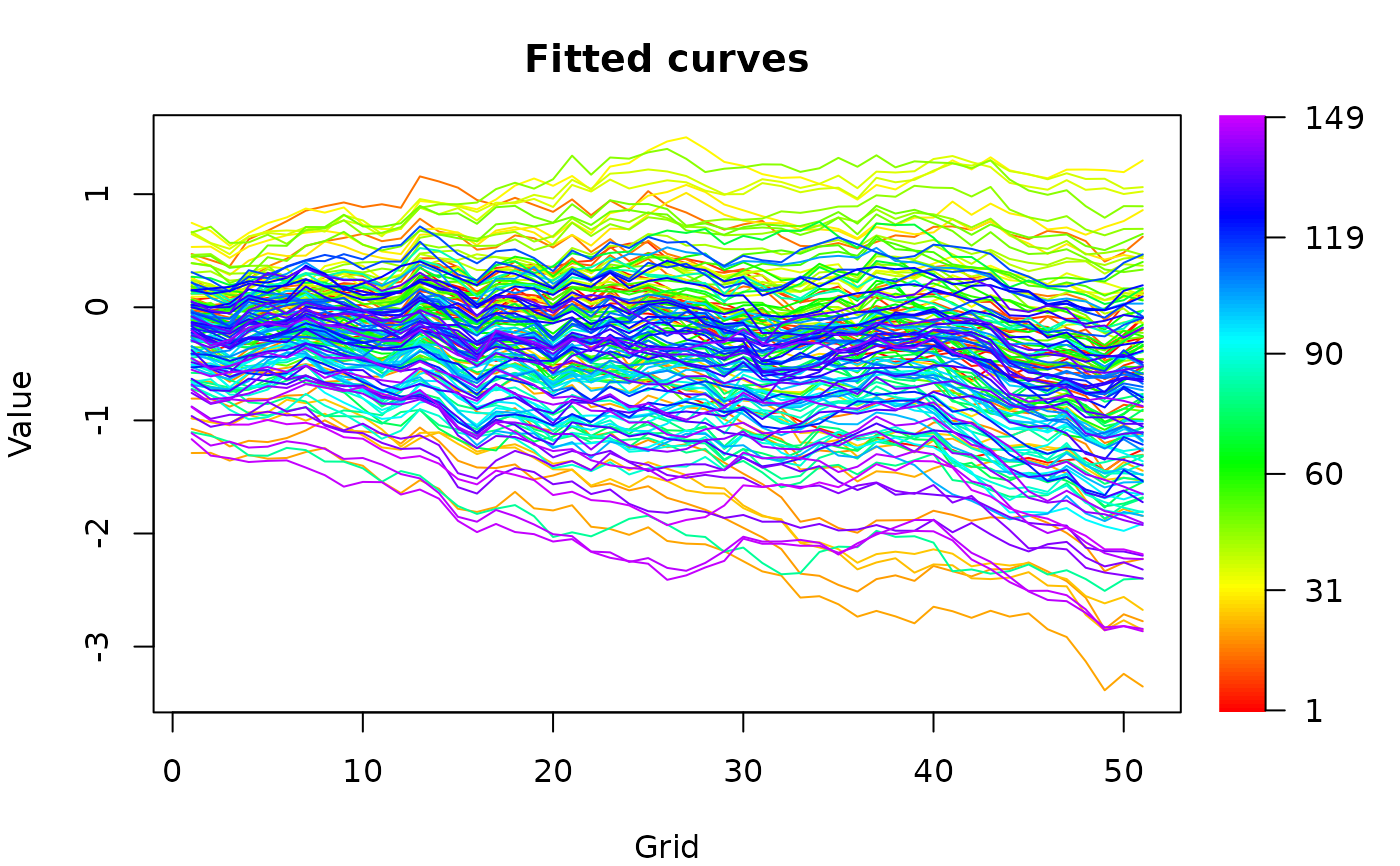
time as in plot_curves(). type = "fitted" draws the fitted curves on the
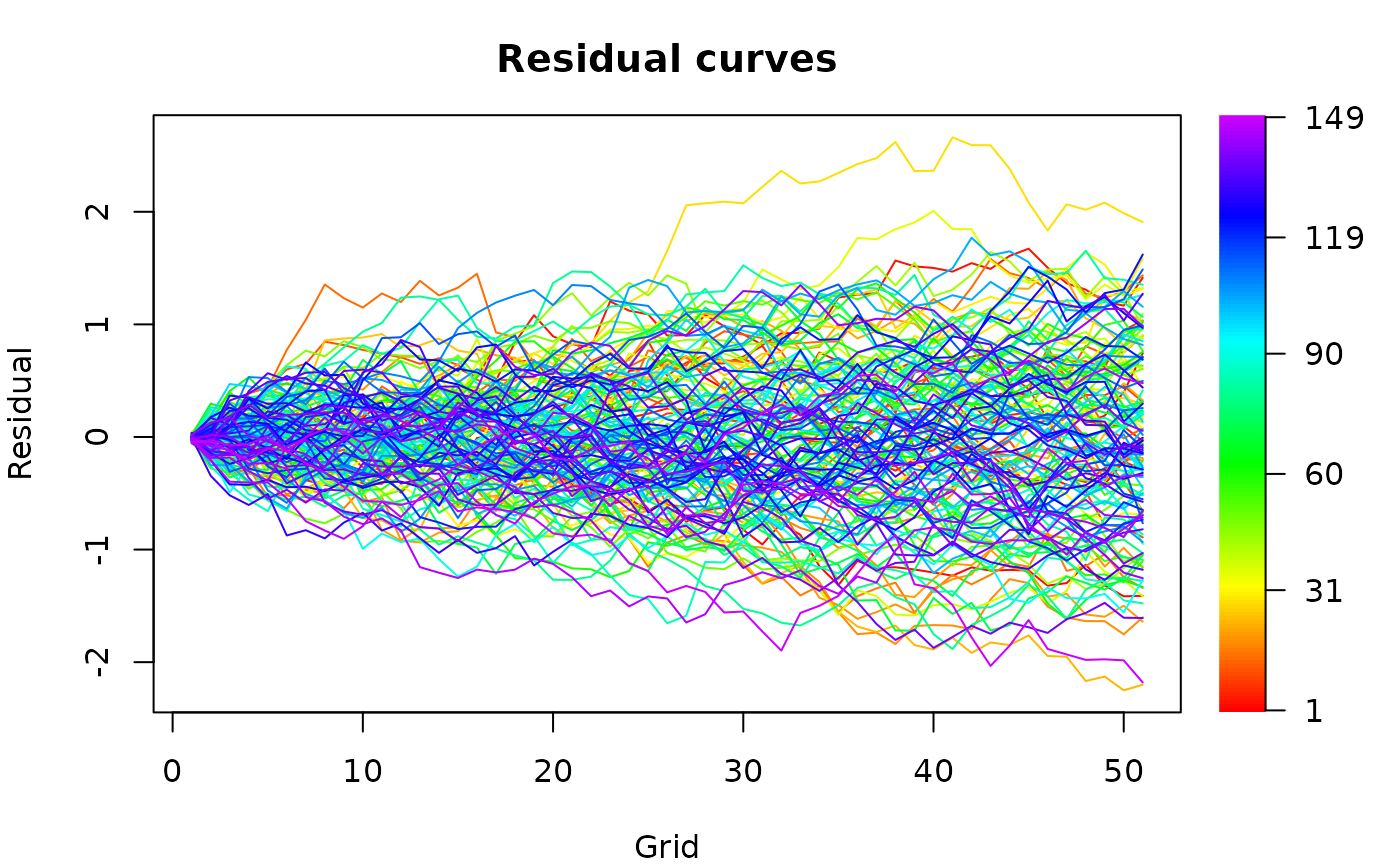
scale of the data, and type = "residuals" draws the residual curves. The
first max(p, q) curves have no fit and are left out.
Arguments
- x
A fit from
farfima()withmethod = "farma".- type
"fitted"or"residuals".- argvals
Grid values. Defaults to the row names of the curves if numeric.
- xlab, ylab, main
Axis labels and title.
- ...
Other arguments passed to
graphics::matplot().
See also
fitted() and residuals()
for the curves.
Examples
sim = sim_farfima(n = 200, d = 0.3, p = 1, q = 0, no_grid = 51, seed = 1)
fit = farfima(sim, d = 0.3, order = c(1, 0), trim = 50, verbose = FALSE)
plot(fit)
 plot(fit, type = "residuals")